
Make a simple geo heatmap
Show data on an interactive map with varying intensity and size

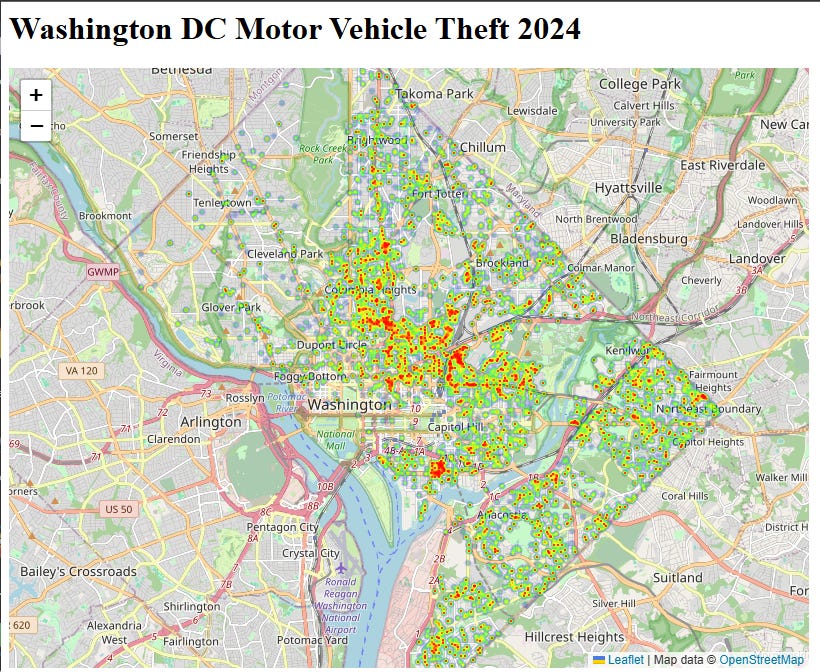
Heatmaps combined with interactive maps can be a powerful way to visualize spatial data that varies in intensity.
You can get the full code used to generate this map here: https://github.com/ccozad/heatmap-demo
Technology
Vanilla JavaScript
Leaflet A JavaScript library for mobile-friendly interactive maps
heatmap.js A library for rendering heatmap visualizations
leaflet heatmap plugin A plugin that allows heatmaps to rendered as map layers
OpenStreetMap OpenStreetMap is an open source provider of map data
Axios HTTP Promise based HTTP client
Node.js Free, open-source, cross-platform JavaScript runtime environment
Express Fast, opinionated, minimalist web framework for Node.js
Data
This demo uses 2024 Washington DC crime data from the US government data clearinghouse https://catalog.data.gov/dataset/crime-incidents-in-2024
We map the intensity to the age of the crime event so more recent crimes show with higher intensity. There is a data pipeline area of the project that can be used to filter the data to only motor vehicle thefts and reduce the amount of data passed to the browser.
General approach
To create an interactive map with a heatmap we have to take the following steps:
Find a dataset with longitude and latitude information
Clean up or minimize the data
Load the leaflet, heatmap.js libraries, plugins and styles for rendering the map layers
Load your data
Configure the map layer
Configure the heatmap layer
Render all of the map layers
More details
There’s additional commentary with code details in the git repo https://github.com/ccozad/heatmap-demo
Further Reading
Feedback
Leave a comment about what type of topics you would like to see in future articles.